

VS Code: Debugging

Photo by James Wainscoat on Unsplash
It has been said that up to 80% of coding is debugging, and the other 20% is writing bugs! - Visual Studio 2019 Tricks and Techniques
Arguably one of the most important skills developers can posses is how to debug. Debugging is a necessary evil in software engineering, although to some folks it is challenging and fun. There are various techniques for finding bugs, but my favorite has to be related to a question my computer science professor once asked. His query was, “How does one find the last blue wolf in Ireland? Build a fence that divides Ireland in half and wait for a howl.” Now, I’m not advocating fence building or blue wolf hunting, but his point was well taken: one effective way to debug code is to gradually hone in on the problem in binary search fashion until you discover finally discover the source of the problem.
This post is an introduction to debugging in Visual Studio Code. Some reasons for a debugger are:
See inside the execution state while the program is running
Insert breakpoints so you can stop the program
Step through your program line-by-line so you can determine what happened
Experiment with correcting the effects of one bug so you can move on to the next
Getting Started
VS Code has built-in debugging support for the Node.js runtime. It also has extensions for Python, Ruby, Go, C++, PowerShell and many others through the marketplace. In this tutorial we will focus on C++ via GCC on Linux with Ubuntu 18.04.
Step 1: install VS Code.
Next, install the C++ extension for VS Code. Then ensure the build-essential and gdb apt packages are installed:
sudo apt update
sudo apt install build-essential gdb
Now we need to have some code to debug. To do so, we are going to need to open up a folder inside VS Code. Create a folder anywhere you like with mkdir, cd, and touch:
mkdir debugging
cd debugging
touch debugging.cpp
code
You may end up with a welcome screen inside VS Code. You can close this or leave it open depending upon your personal preference. Now open the directory you created above by navigating to “File > Open Folder…” which should bring up a dialog where you can navigate to where the file exists on your file system. My dialog looks like this when I arrive at the folder:

VS Code Open Folder Dialog
Double-click on debugging.cpp on the left side of the VS Code window and enter the following code:
#include <iostream>
using namespace std;
int main (int argc, char *argv[]) {
cout << "Howdy" << endl;
return 0;
}
Now click Run > Start Debugging and specify C++ (GDB/LLDB) and the debugger environment AND g++ as the debugger configuration. The debugger should run and you get a screen similar to the following:

Terminal output with “Howdy” circled in red. Note that VS Code opened launch.json.
The first thing you should note is that this was a successful run, despite the relative obscureness of the output. Second, you should note that VS Code has opened a new file “launch.json” in a hidden .vscode folder which is documented here.
Now let’s get to some debugging!
Breakpoints
Add the following code to the main function before the “return 0;” statement:
int i;
for (i = 0; i < 10; i++) {
cout << i << endl;
}
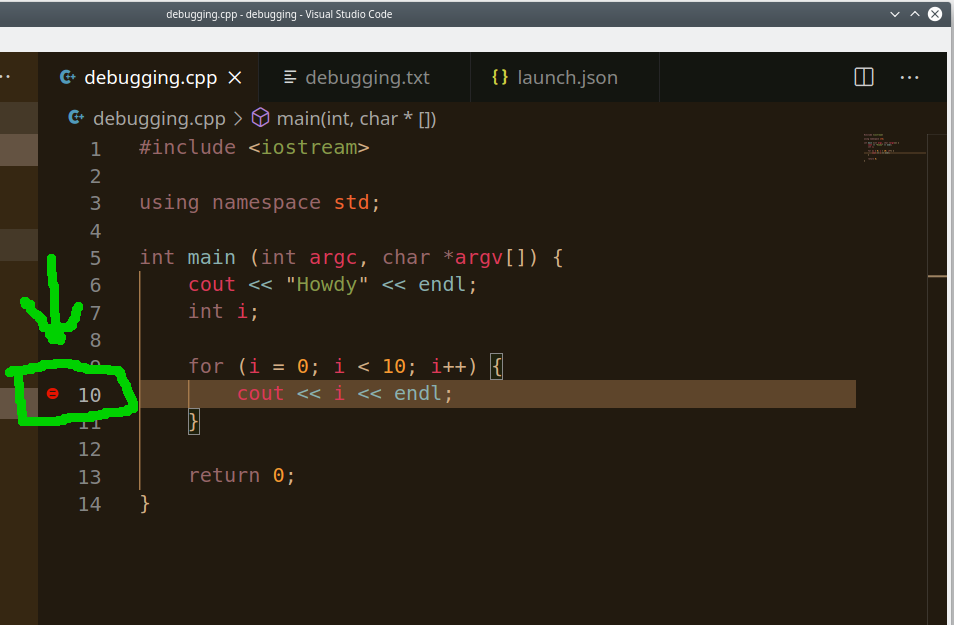
Now we will insert a breakpoint at line 10. According to Wikipedia:
… a breakpoint is an intentional stopping or pausing place in a program, put in place for debugging purposes. It is also sometimes simply referred to as a pause.
To insert your breakpoint, go between the left and right panes of the window until you see a faint red dot. Clicking on the red dot at line 10 and will insert the breakpoint:

Breakpoint in VS Code
Start debugging the program. The execution should pause when you reach the breakpoint. Starting the debugger should have brought up this pane in the window:

VS Code debugging pane
Actions you can perform include:
Continue / Pause F5
Step Over F10
Step Into F11
Step Out Shift+F11
Restart Ctrl+Shift+F5
Stop Shift+F5
more info about debugging is here for the anxious student, but we will content ourselves with the simple “Continue (F5)” action. Click there or push F5 once.
The VS Code terminal should now look something like:

VS Code after 1 step of execution
Click continue or push F5 a few more times to get a feel for the debugger.
Watch Variables
You can watch the progress of any variable that’s in scope. To do this click on the right facing arrow in VS Code while still in debugging mode:

Play / debug button in VS Code
You can see from that image that the value of the variable named “i” is currently 5. Additionally we can see that there is a breakpoint on line 10.
We will now set up a watch variable. To do this mouse over the WATCH near the middle of the left pane. You should see a “+” symbol appear. Click it and the watch the variable “i” as shown below:

Enhanced Breakpoints
Conditional Breakpoints
You can set breakpoints to occur when a condition or a set of conditions is true. As an example, we will set a conditional breakpoint to occur on line 10 whenever the variable i is 5. To do so, right click on your breakpoint and click "Edit breakpoint..." Then enter "i==5" into the "Expression" drop down menu. This is because = means assignment and == means comparison in C++. Your breakpoint should update with an = sign as in the figure below:
Conditional breakpoint in VS Code
There are also other breakpoint types including inline breakpoints, function breakpoints, and data breakpoints.
For reference the entire code block from the examples above is:
#include <iostream>
using namespace std;
int main (int argc, char *argv[]) {
cout << "Howdy" << endl;int i;
for (i = 0; i < 10; i++) {
cout << i << endl;
}
return 0;
}
There are many other resources online about debugging. We have only covered a few here.
Happy debugging!
Credits
Visual Studio 2019 Tricks and Techniques: A Developer's Guide to Writing Better Code and Maximizing Productivity, Authors: Schroeder, Paul, Cure, Aaron, Price, Ed
https://code.visualstudio.com/docs/cpp/config-linux
https://code.visualstudio.com/docs/introvideos/debugging